Viewing Content on Sales Layer and Excel Mode
There are three ways to view your uploaded content on Sales Layer. By default, when you select categories, they will be displayed in
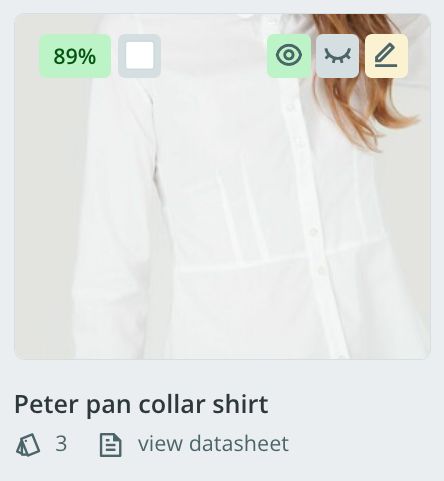
Let’s look at the information we can see when we select
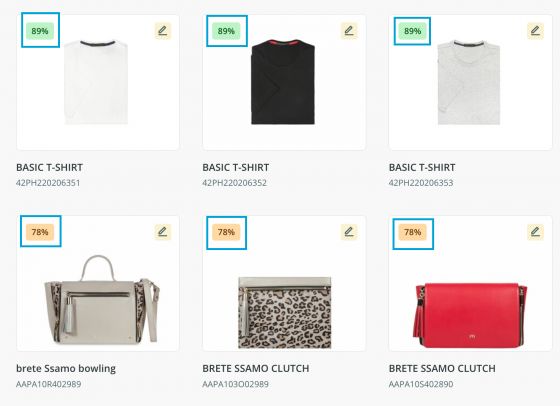
In addition to this, we can also see the status of each product and set it to three options:
When viewing the content in
Warning: Be aware that if you perform a bulk operation without having applied any filters or selected any items, this bulk operation will be applied to every item.
There are also several ways of sorting your content, such as by alphabetical order, by order of Quality Score, or by the user who imported the products, as well as various other options.
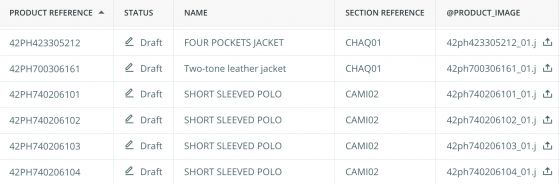
Having seen both these modes, let's look at the final one, known as
To make Excel mode more comfortable, Sales Layer gives you the option to create customized views that you can save and use whenever it is needed. You do not have to filter again by column: simply select your view and start working. To do this, click on the Default button and choose Modify Columns.
Here you can choose which columns you want to display, simplifying the content view by filtering the columns you need. This will make your work process much faster and more efficient.
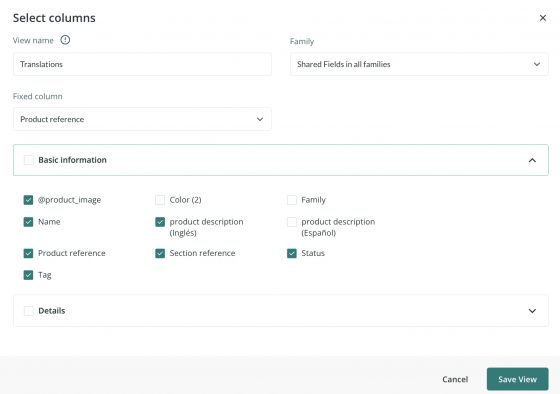
It is also possible to select a fixed column to filter in alphabetical order and to choose the size of the whole table thanks to the
Note: The performance of saving the item is affected by many selected columns. Therefore, it is advisable to keep the number of columns to a minimum to ensure the saving process is as efficient as possible.
The Excel Views are customizable by the user. Each user can see and access those that they have personally saved, but not those of others. This allows independent users to work without interference.
Note: It is possible to create a maximum of 10 views, per table and user.
As well as filtering the data displayed on each product via the column selection, you can also filter using the Search Bar or with Tags. We will look at both of these in more detail in the corresponding sections.
Warning: The search bar returns only results included within the same table from which you are performing the search. In other words, you won´t be able to use the search function to access data from another table. For example, if you are in the Variants table, you cannot search for data that belongs to the Product table.
Tip: Please, note that the cells in the Edit Mode might change color as follows: a/ Yellow: when you fill or edit the category, image, or file fields using an invalid value. The system will delete or correct the information in the field and will mark the cell in yellow. b/ Red: in the case of an error in the reference field, for example, when you create or edit a record using an existing code.