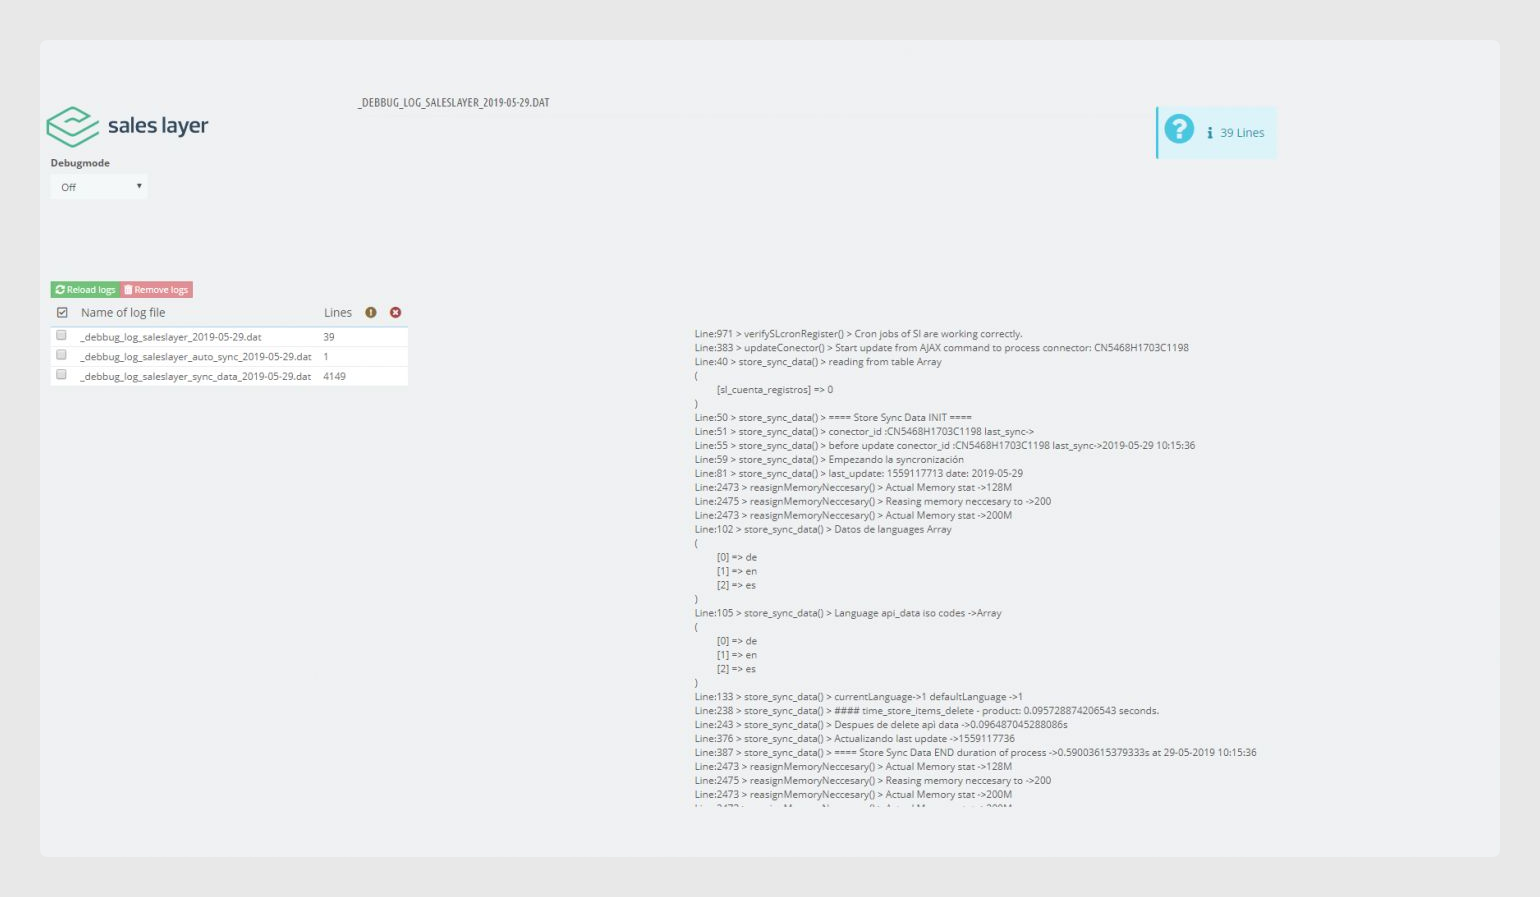
In Diagnostics, there is a tool to list all diagnostic files generated by the plugin.
Initially, there are many options when executing with debug mode Off. In that mode, files are only created if there are errors, and debug texts appear only with errors.
Increasing the debug level shows more information about CPU and memory usage. This information can be used when developing, installing, and fixing different issues. By default, it is better to keep the option in mode Off, only for errors, so large files are not generated.
Diagnostic files should be deleted automatically after 15 days. Errors in the file appear with an icon and a red background. They show a short message and a Sales Layer reference so you can check the information.
Example:
## Error. Creating category ID: 91
That message describes an error for a category whose reference in Sales Layer is “91”.
If the error message shows no reference, it may be because there is an issue in another part of the code. In that case, identify the file in the general log whose name begins with:
_debbug_log_saleslayer_sync_data_
That name is followed by the date of the issue. In the file, you can find more information by clicking the error icon, and you can move from one error to another to check the full list.
Was this article helpful?
That’s Great!
Thank you for your feedback
Sorry! We couldn't be helpful
Thank you for your feedback
Feedback sent
We appreciate your effort and will try to fix the article