Having accurate and complete product information helps customers make better purchasing decisions and improves catalog publication across marketplaces and sales channels. To measure how complete your information is, Sales Layer assigns each item a Quality Score, shown as a percentage directly on the thumbnails in the Products section.
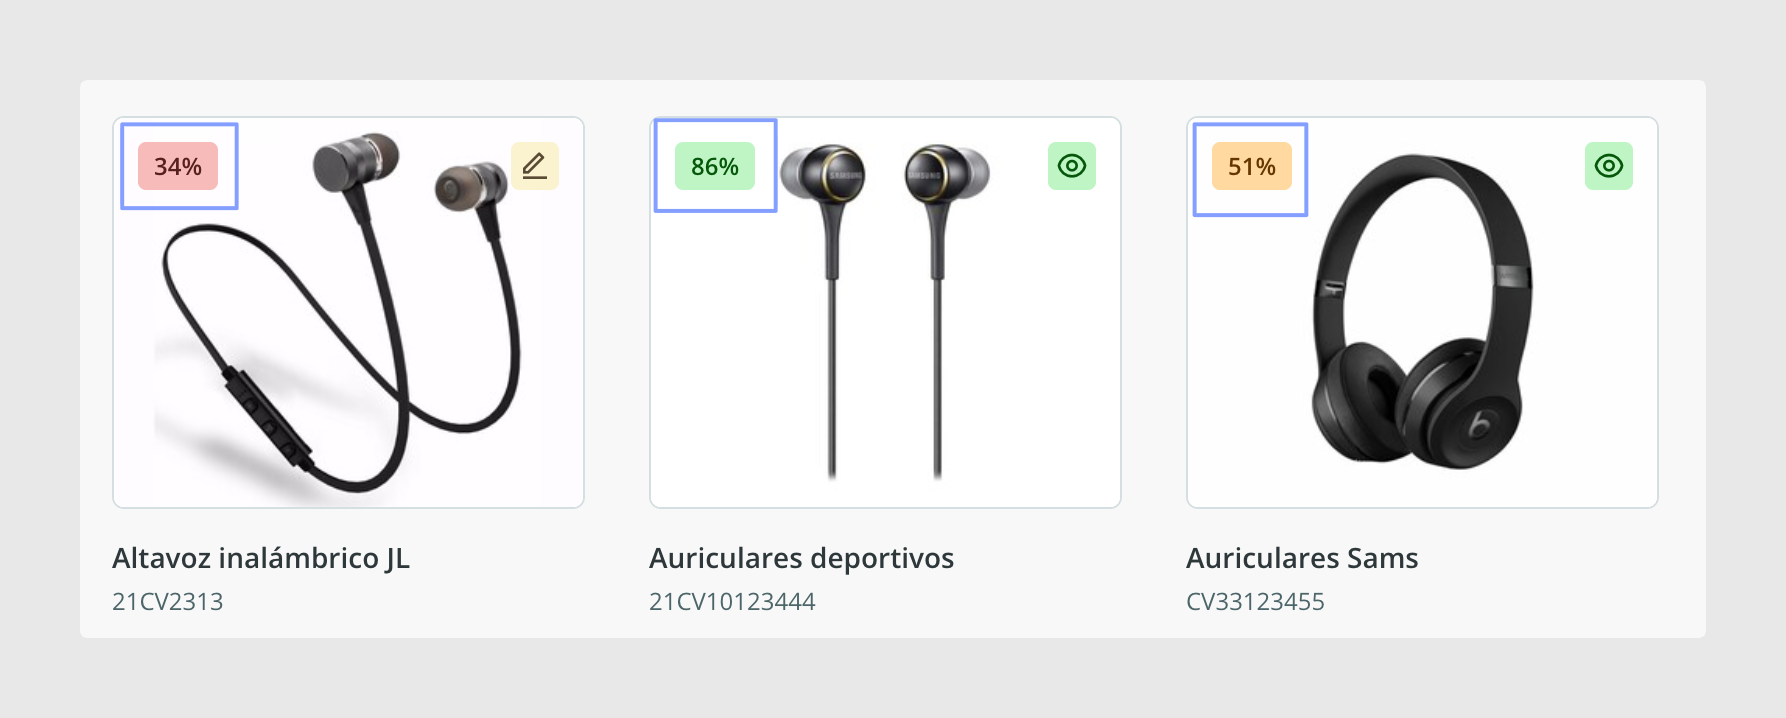
The Quality Report also provides a centralized tool where you can review and improve the quality of the data across your entire catalog more efficiently.
What the Quality Report shows
Summary
The first tab of the Quality Report provides a summary of how complete your information is overall and by table, such as Categories, Products, and Variants. This gives you a quick overview of which areas of your catalog are more complete and where additional work is required.
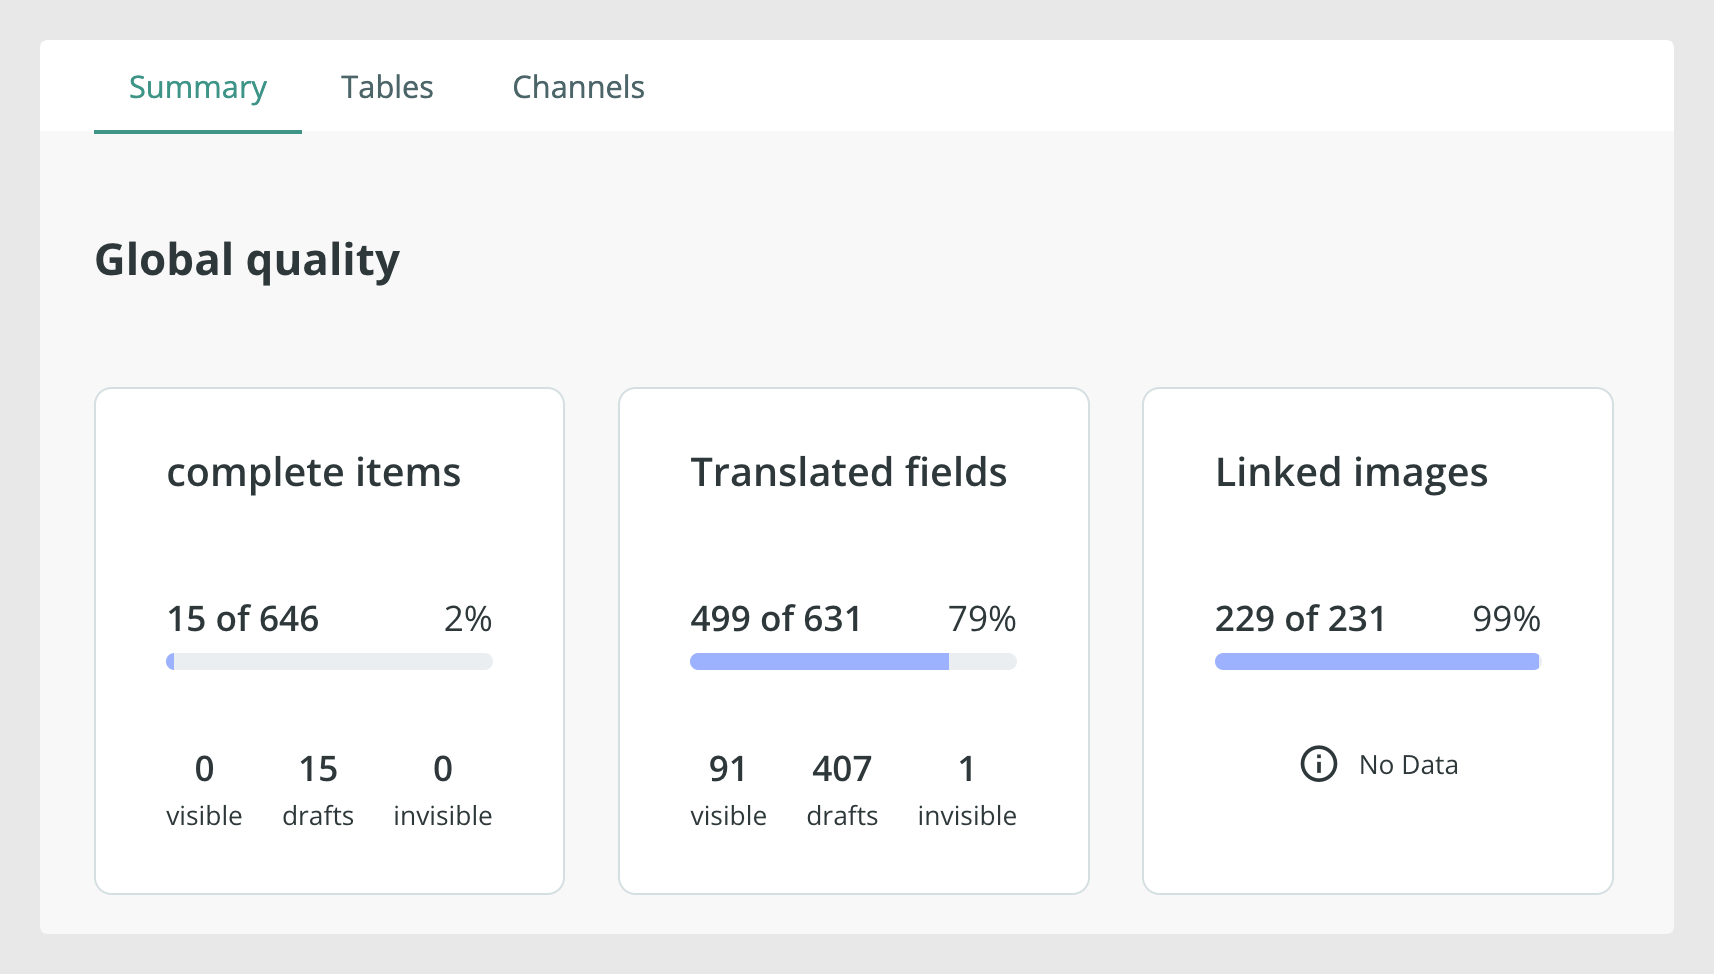
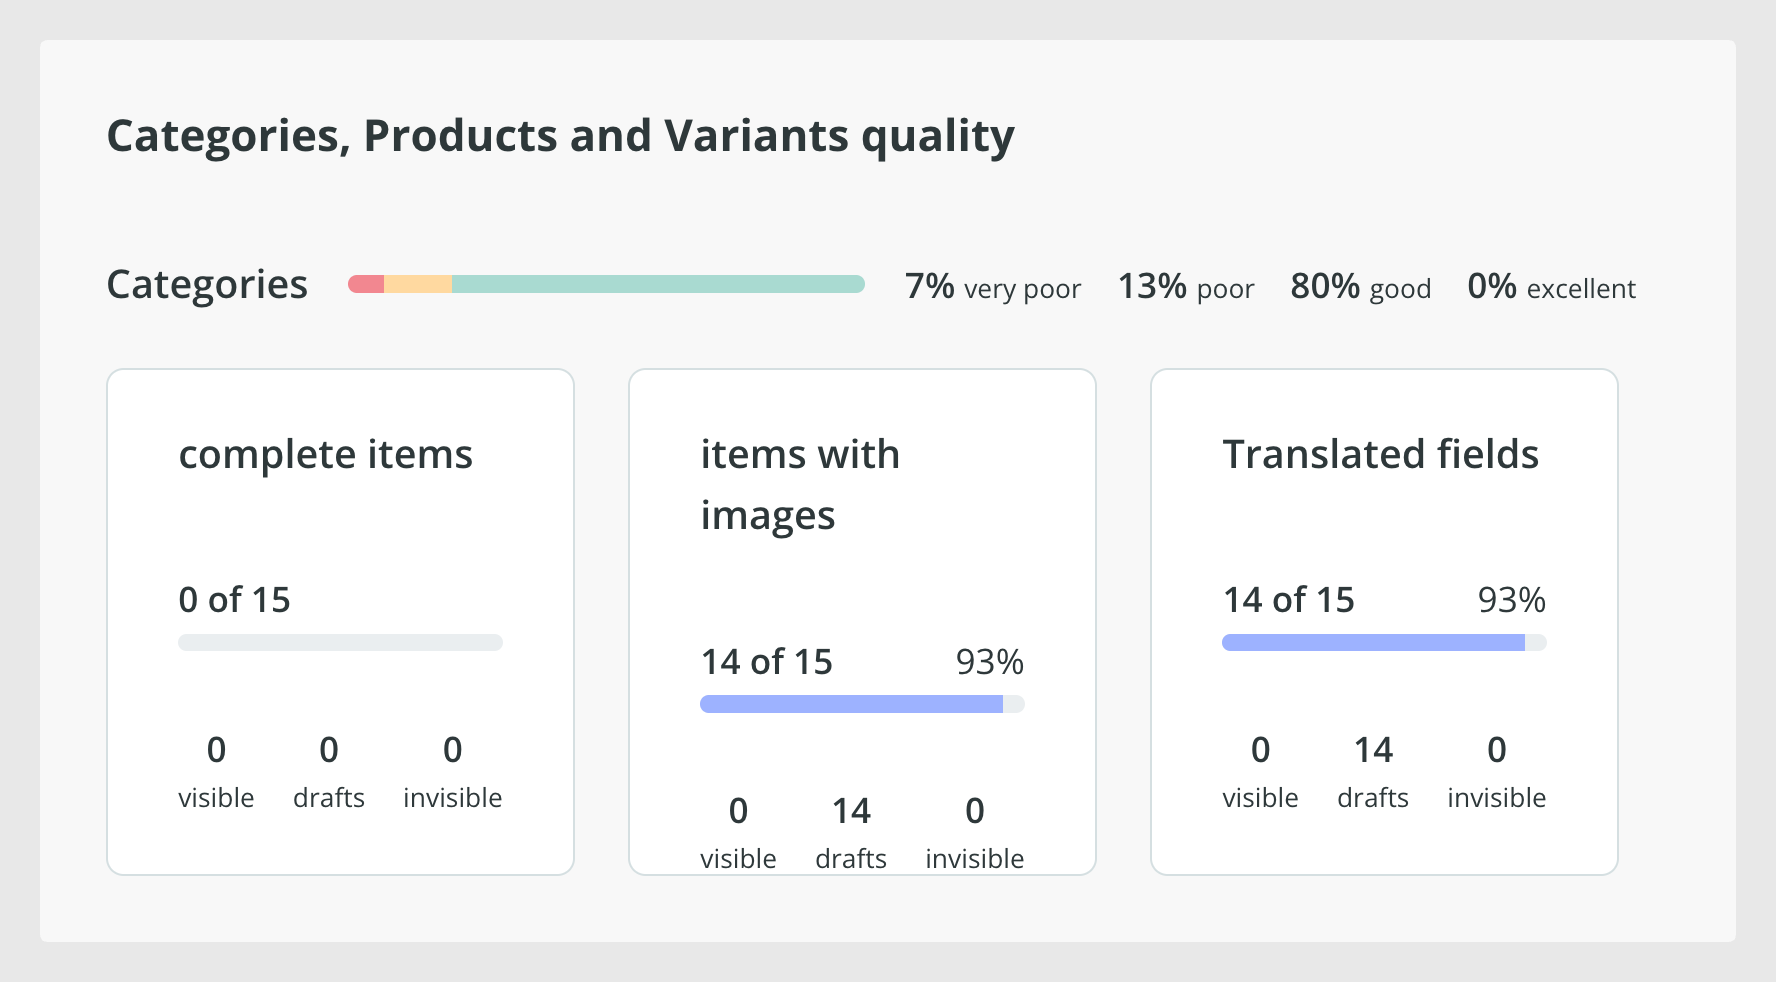
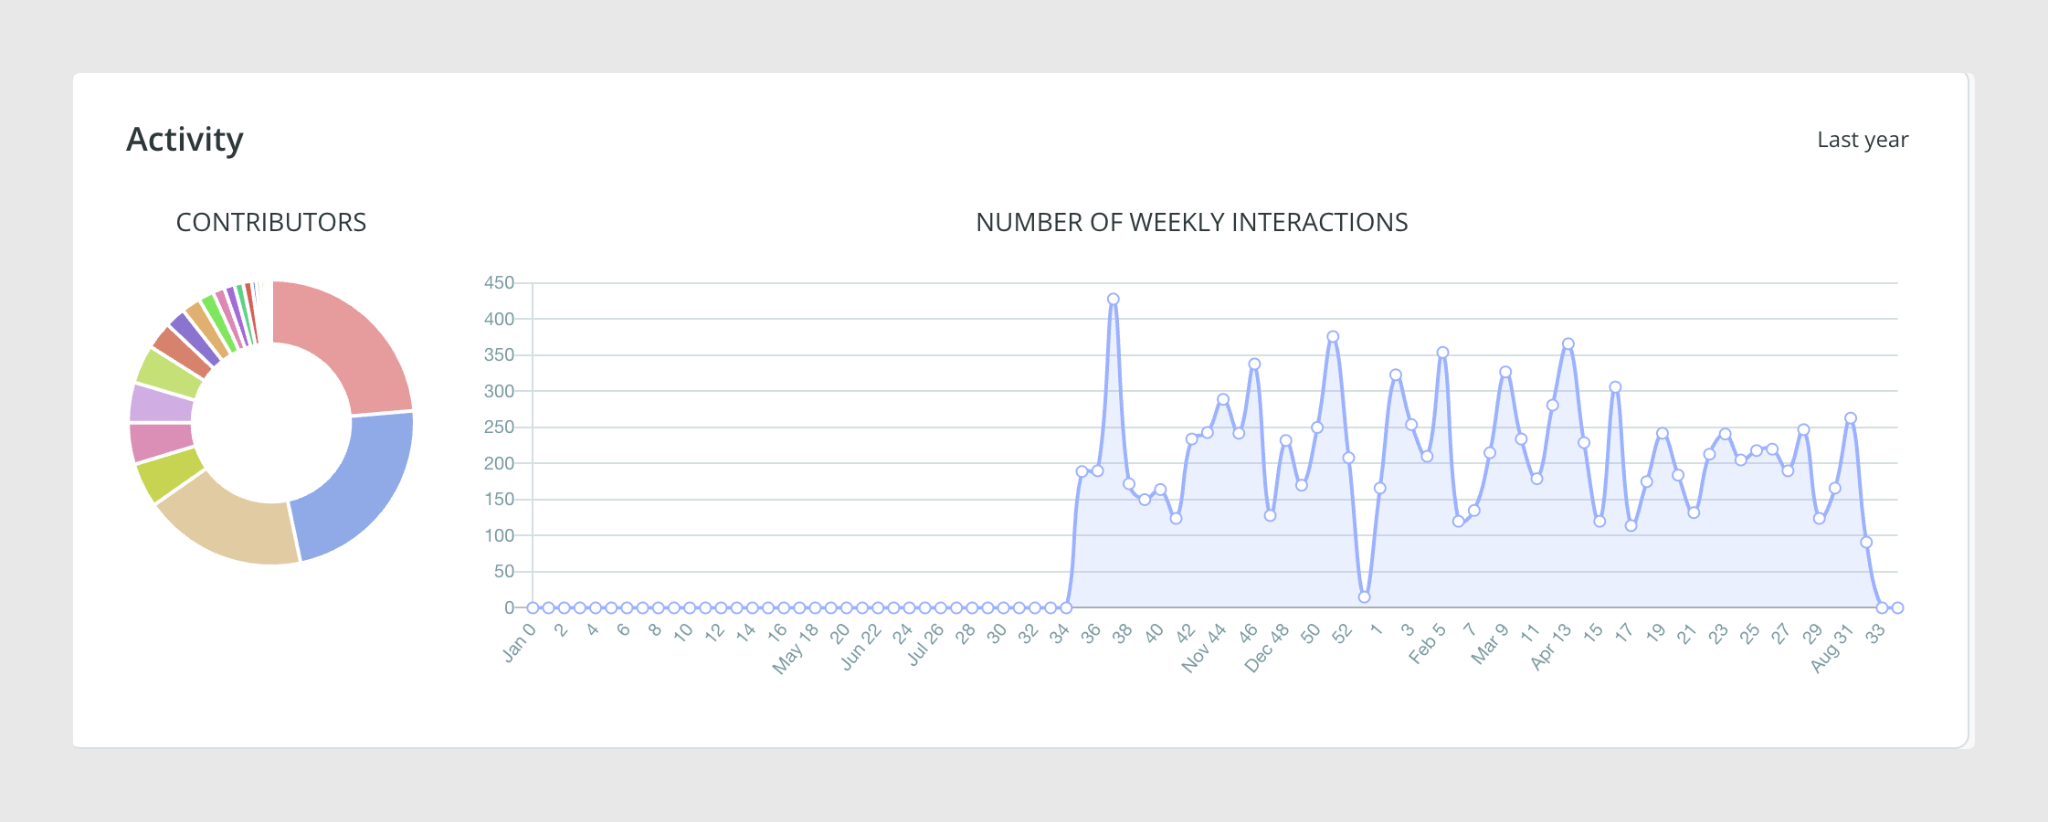
It also includes a chart where you can review the evolution of the data and the percentage of participation of each team member by hovering over the chart.
Tables
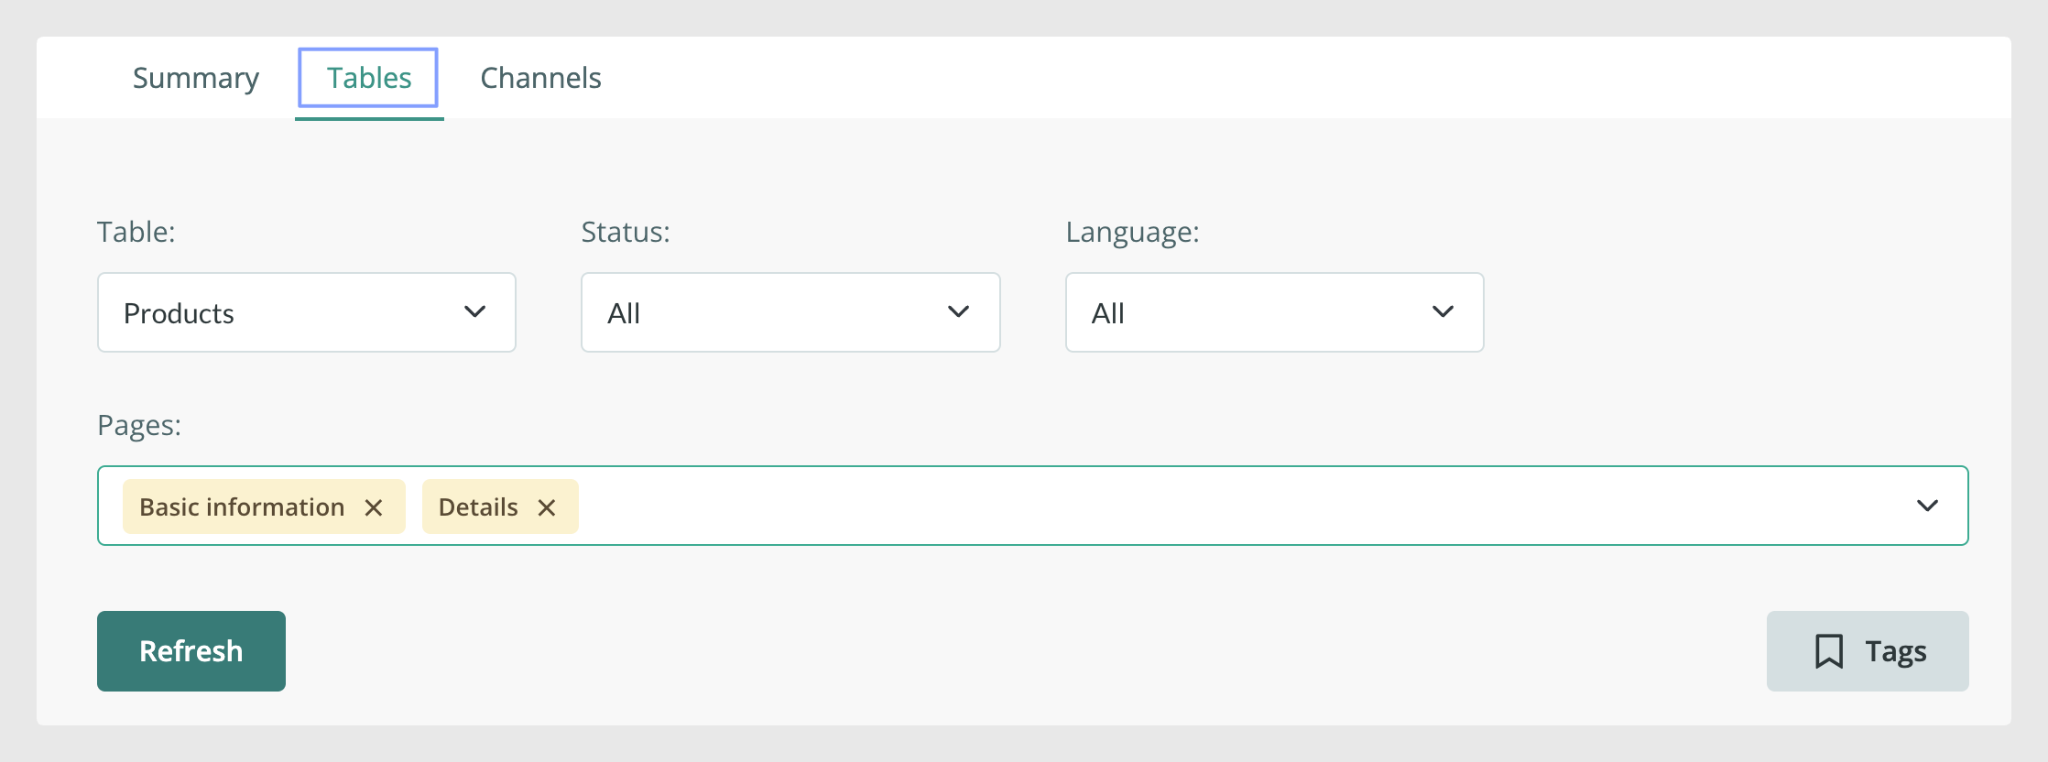
The second tab, Tables, provides more detailed information about all the fields in your catalog.
Using the available options, you can filter by table, status, language, tags, and even by form page to display only a specific group of fields.
Once you have applied the desired filters, you can see the list of fields and their overall completion percentage across all catalog items containing those fields.
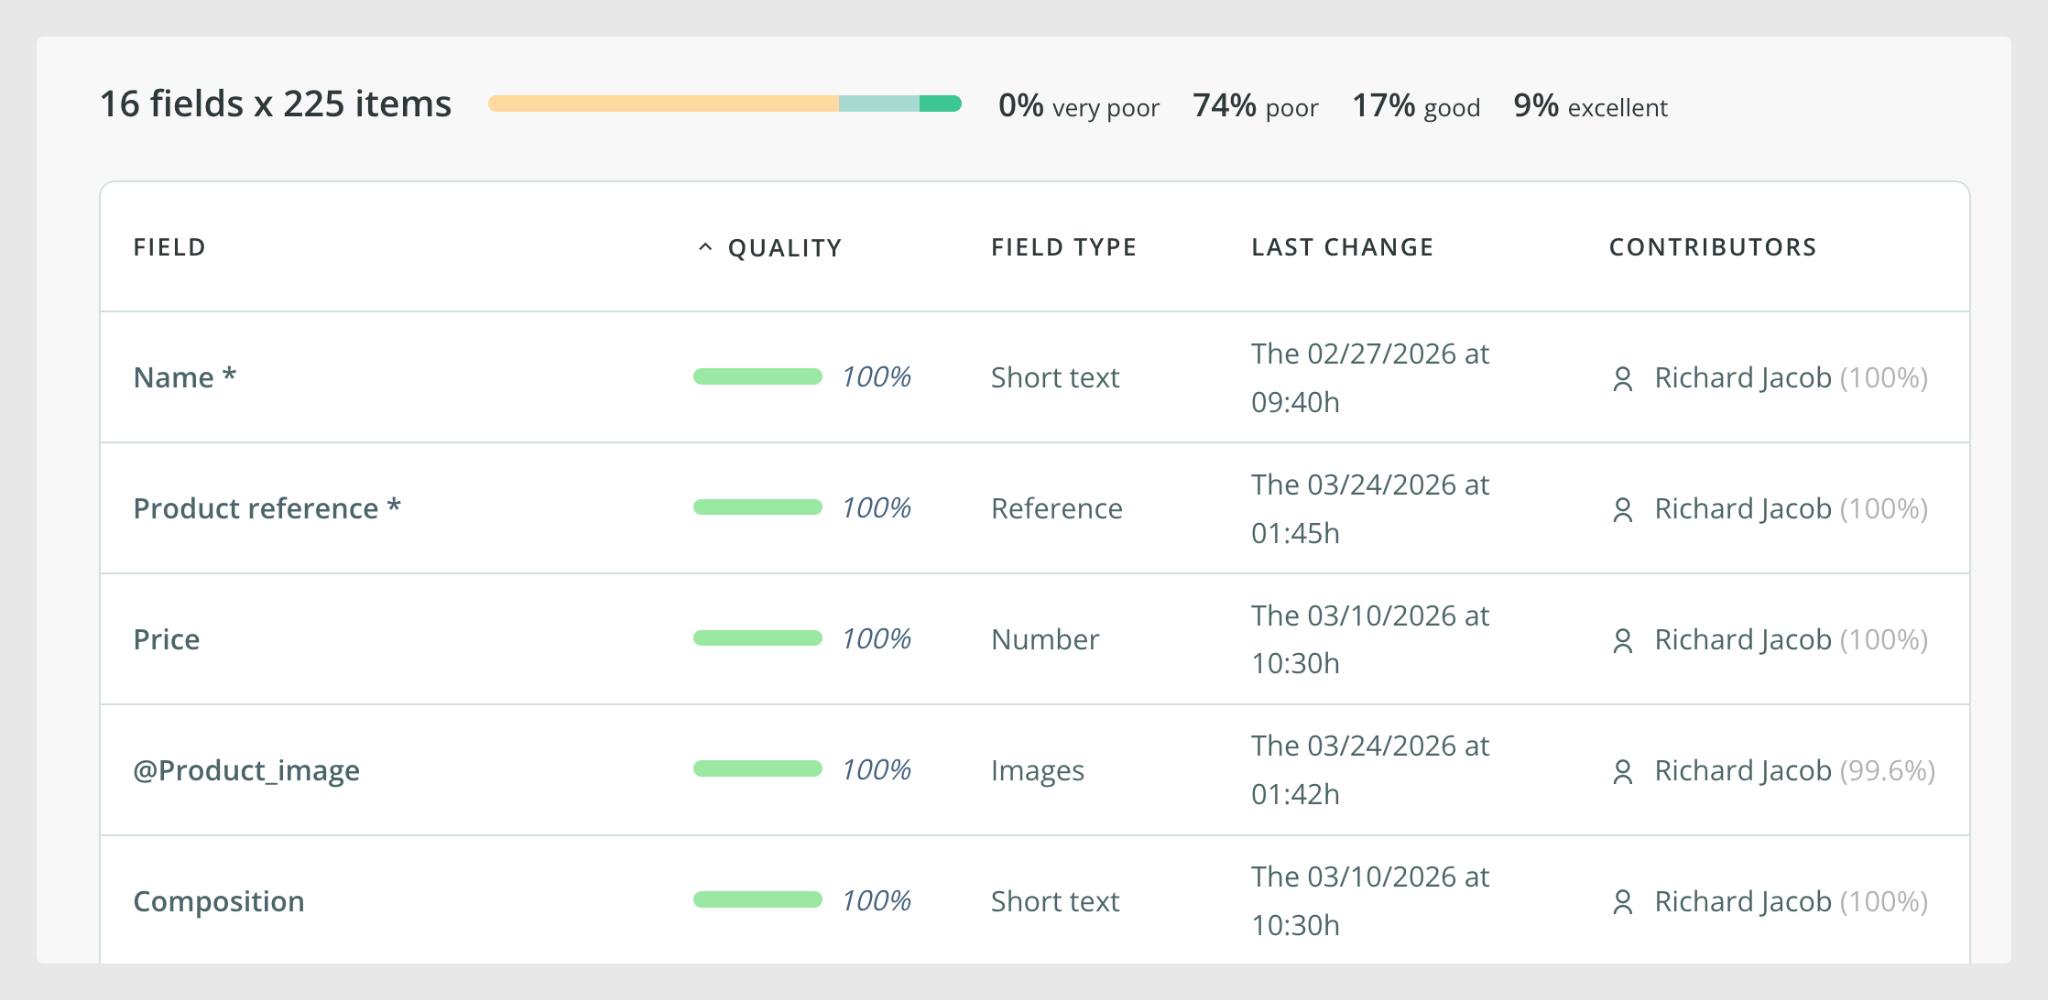
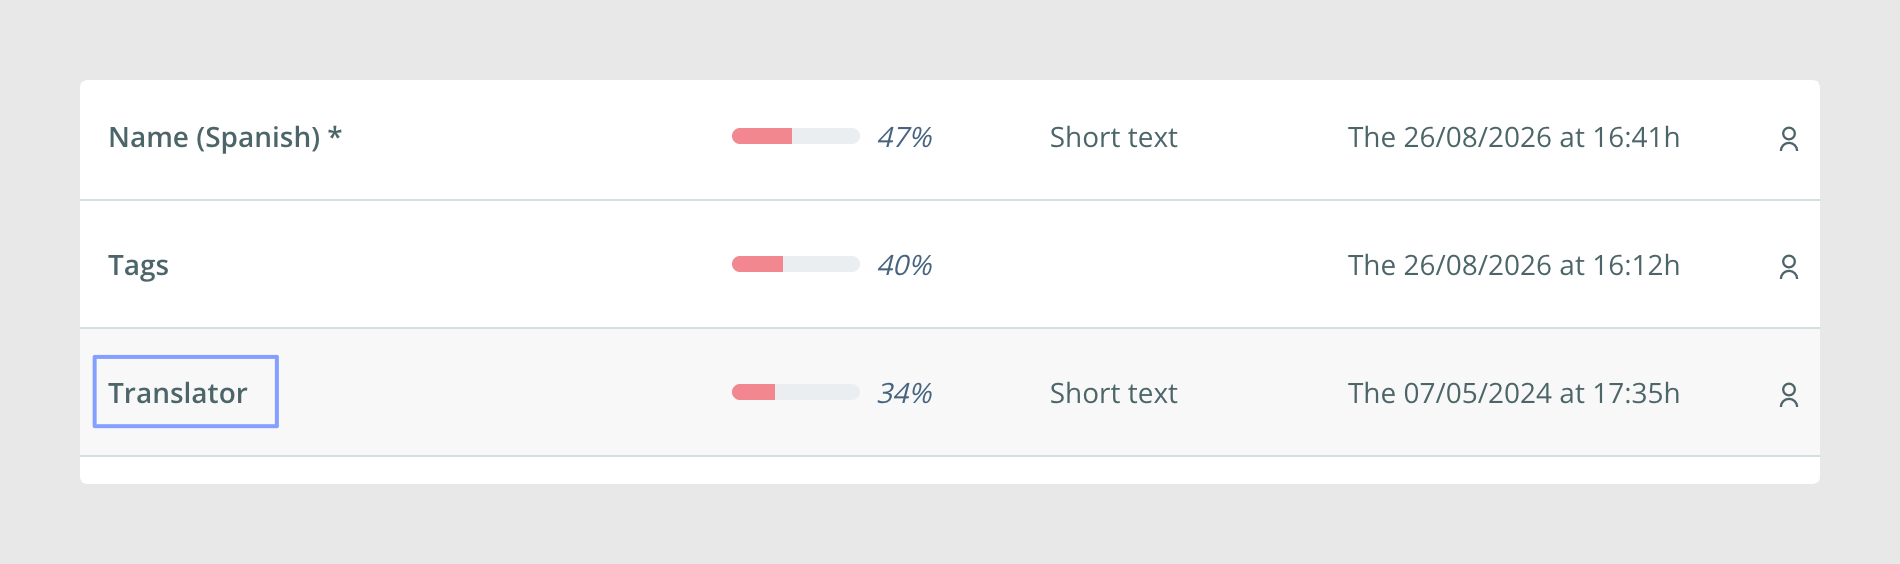
To review and complete fields that have a score below 100%, click the field. You will automatically be redirected to the corresponding section.
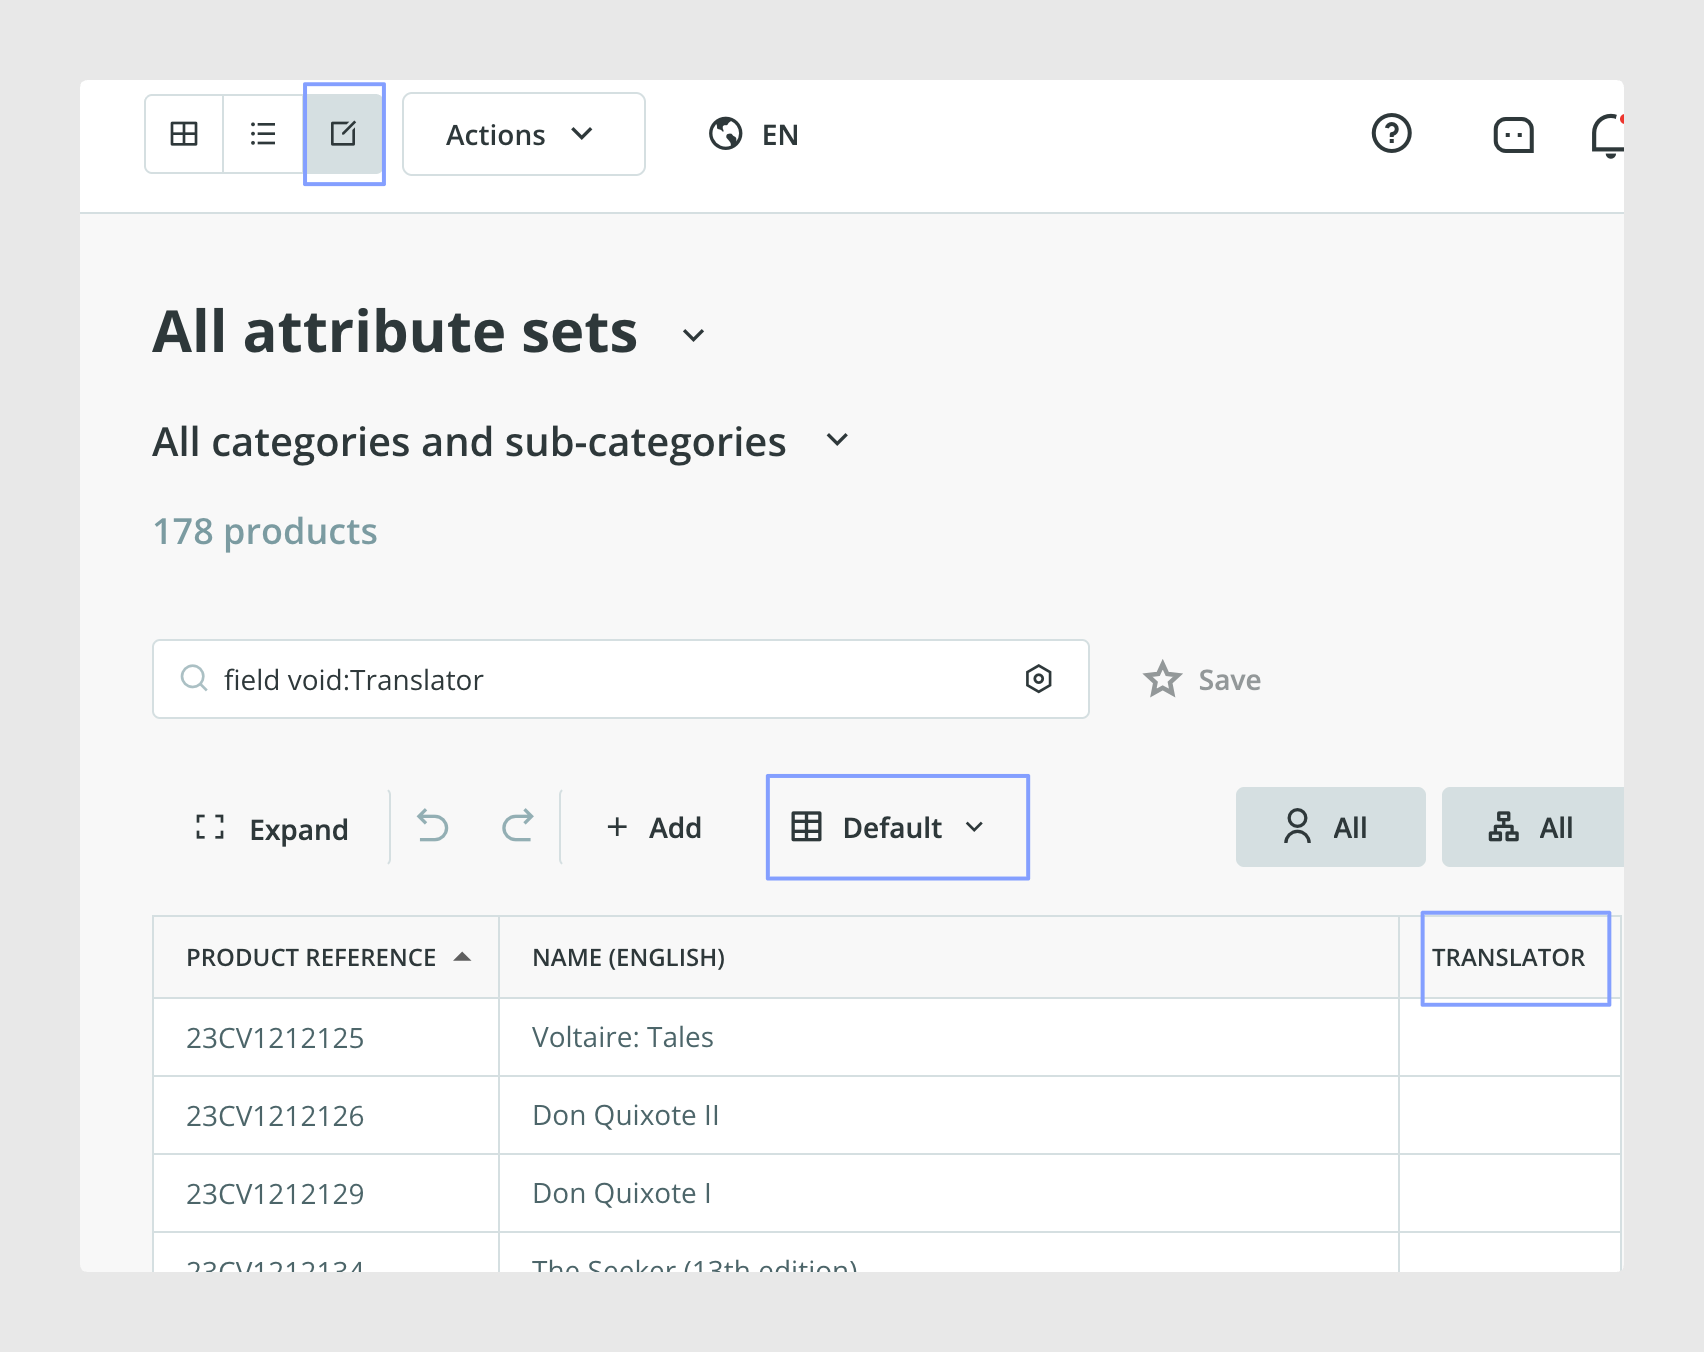
For example, clicking the Translator field takes you to the Products table and filters the results to show the products where that field is empty.
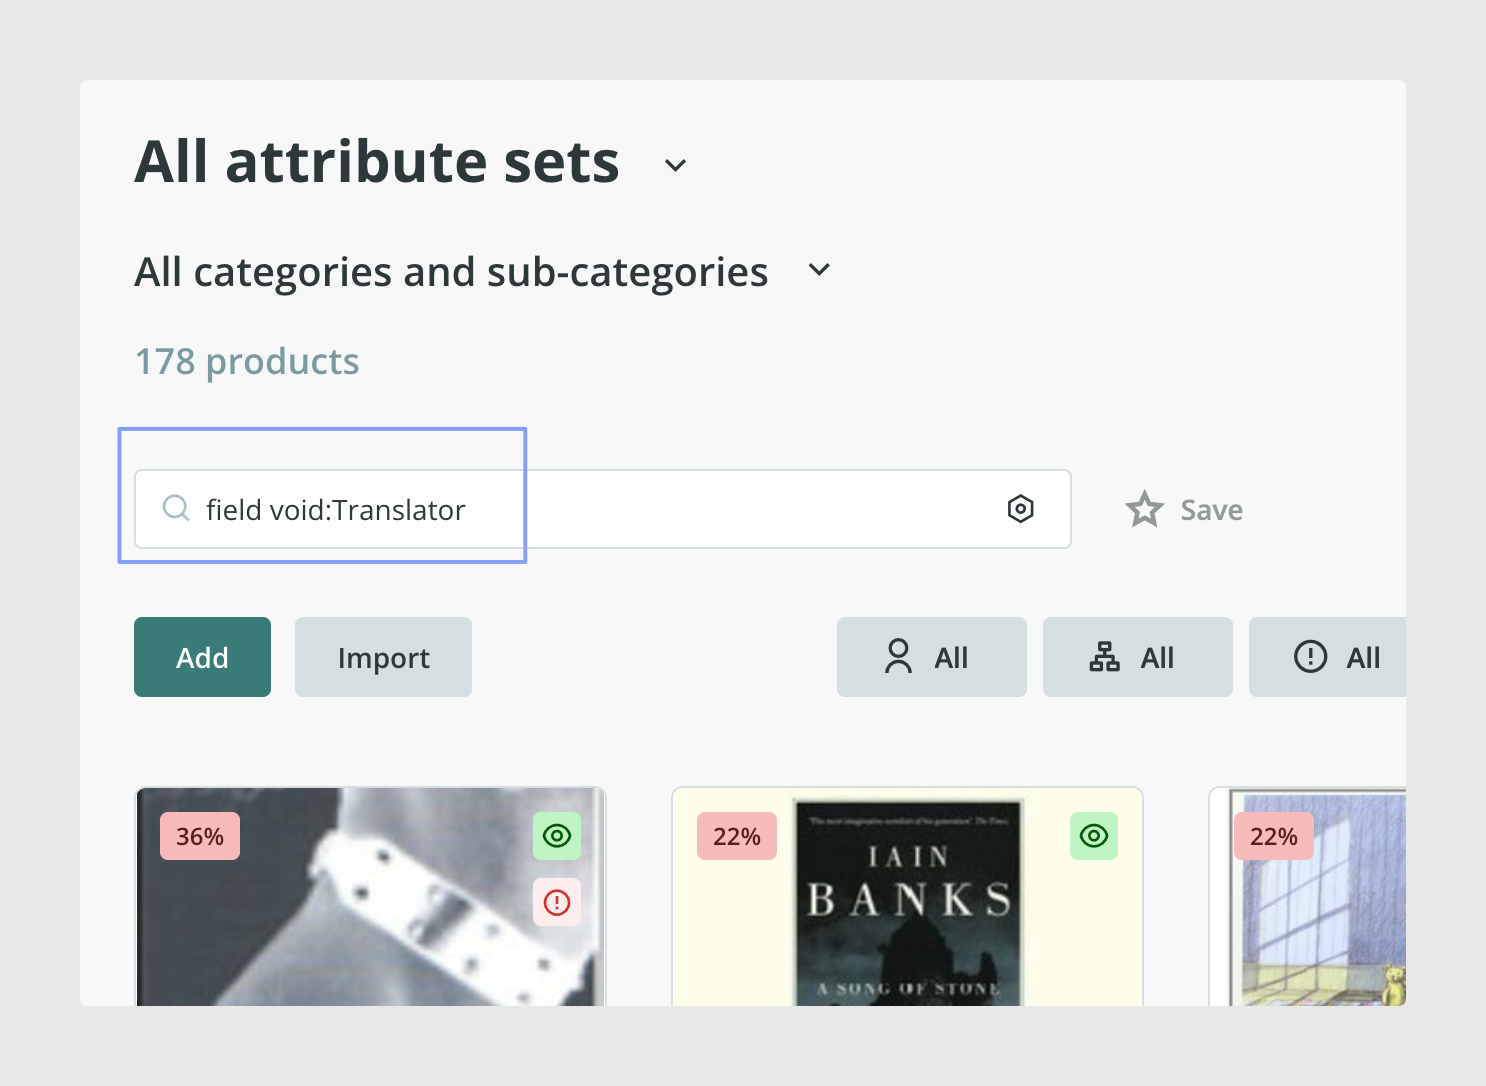
From there, you can switch to Edit/Excel mode to update multiple products more quickly. In Excel mode, click Default and select Modify Columns to display only the fields you need while completing the missing information.
Channels
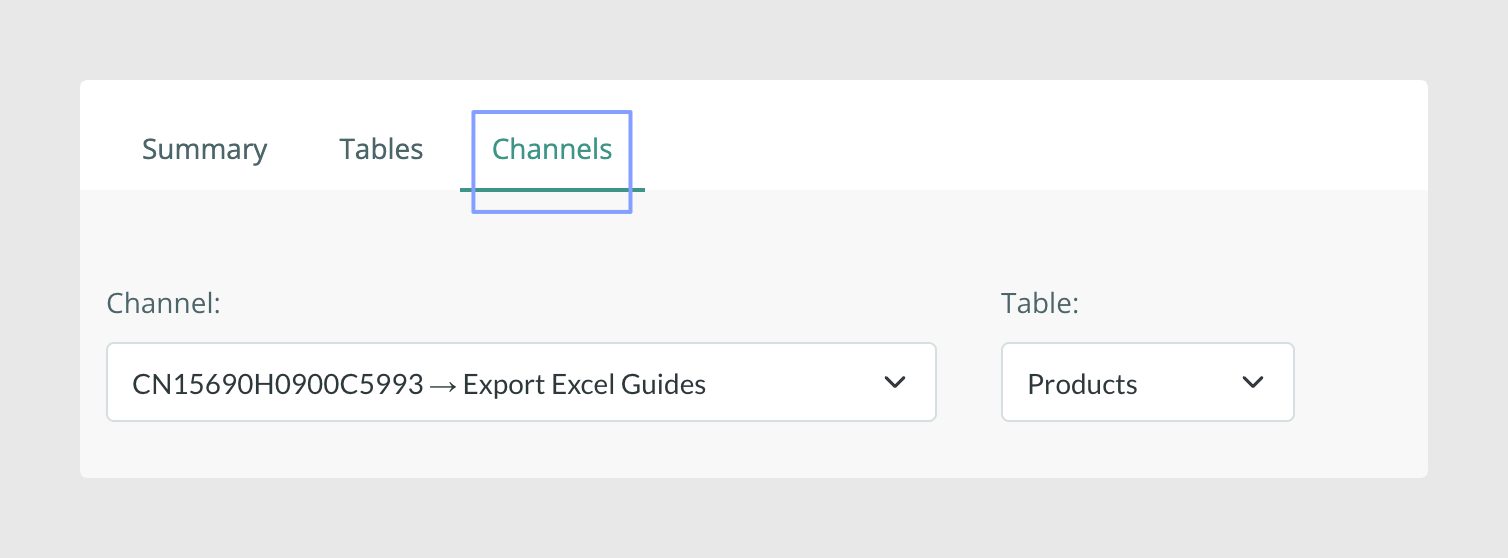
If you want to review the fields mapped in a connector and check whether any information is still missing, use the third tab, Channels, and filter by the required connector.
Mark a field as not applicable
Sometimes a field exists in the form but does not apply to a particular product, even though the product belongs to the same Attribute Set.
In this situation, you can mark the field as not applicable so that it is excluded from that product's Quality Score calculation and does not negatively affect its score.
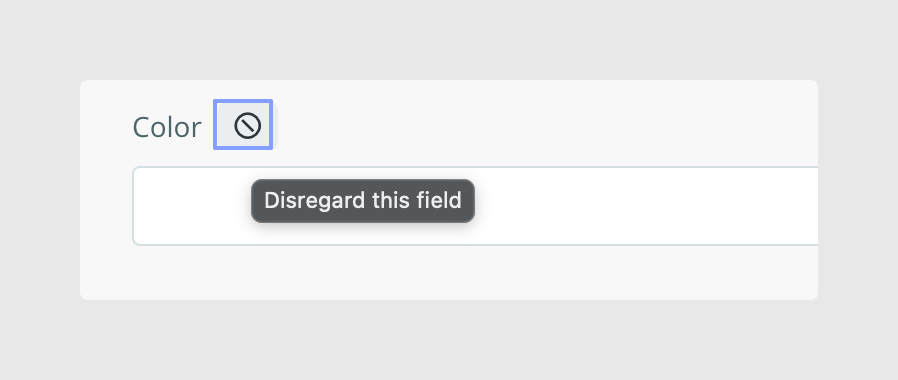
To do this, open the product form and click the icon displayed above the empty field.
The field name will appear crossed out, indicating that it has been excluded from the calculation.
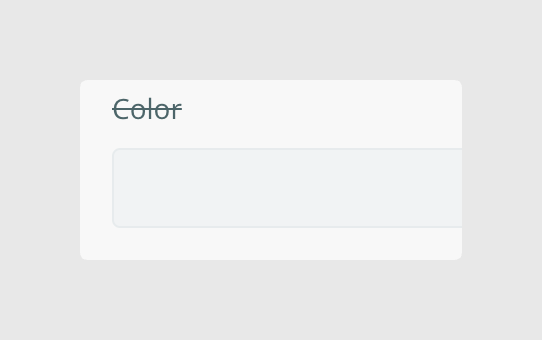
To activate the field again, simply enter or import a value into it.
Some fields cannot be excluded from the Quality Score calculation. These include:
- Attribute Set
- Reference
- Product Name
- Category Reference
- Description
- Image
- Status
- Tags
Hide not applicable fields in the form
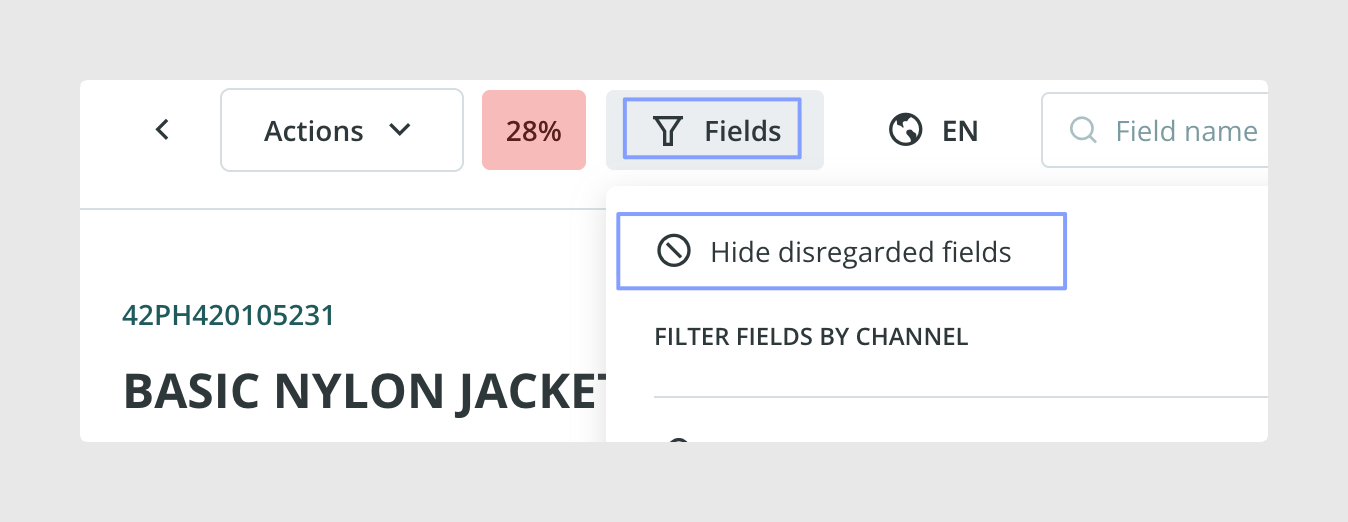
If you want users to focus only on the fields that still need to be completed, you can hide fields marked as not applicable from the form.
At the top of the screen, click Fields and select Hide disregarded fields.
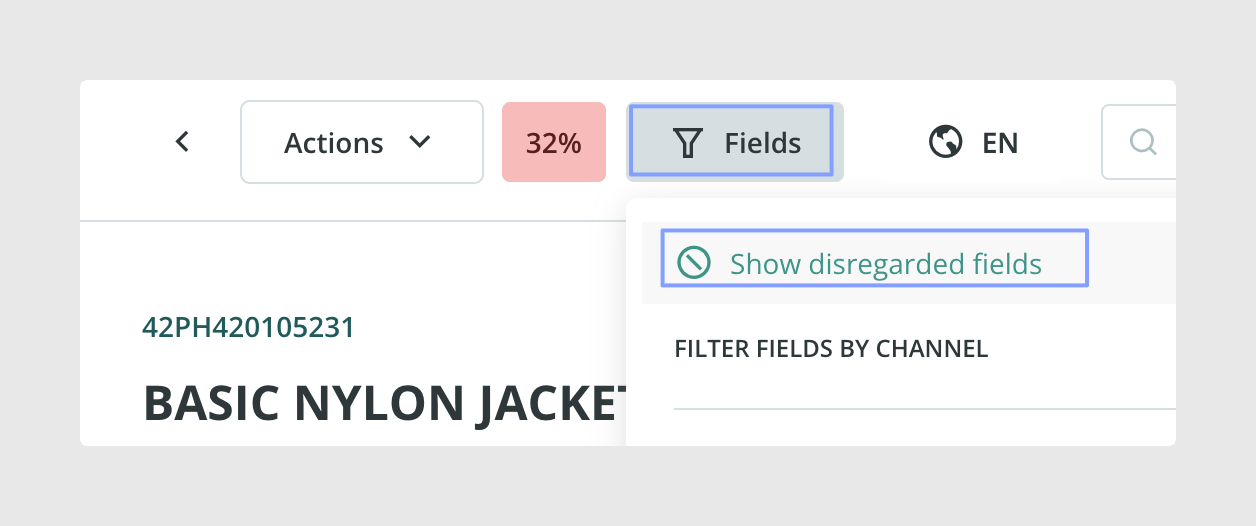
To display them again, click Fields and select Show disregarded fields.
Apply not applicable fields in bulk
If the same unused fields affect multiple products, you do not need to update them individually.
Go to Actions > Modify in bulk and use Disregard empty fields or Reactivate disregarded fields.
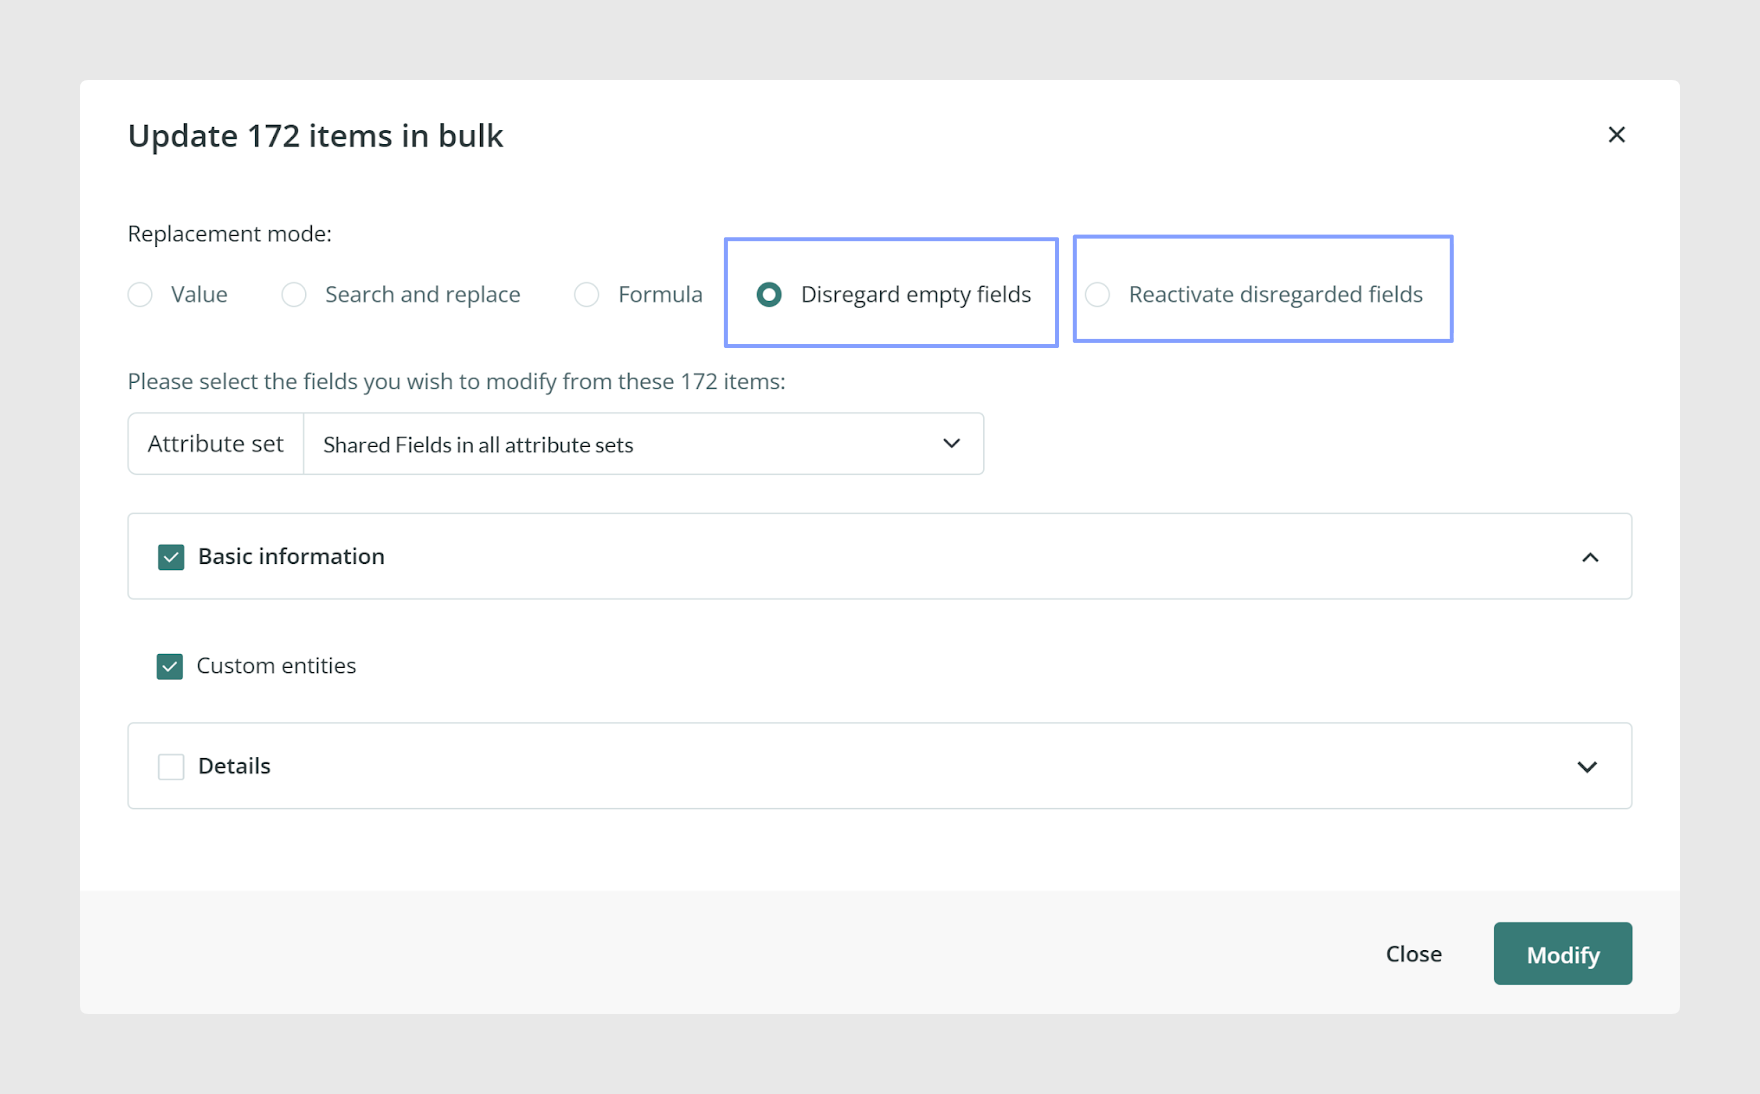
This is useful when a field is part of the product structure but does not apply to an entire group of products.
How not applicable fields affect the Quality Score
A field marked as not applicable is not considered a completed field. Instead, it is removed from the total number of fields used in the calculation.
For example, if a product has 10 fields and 8 are completed, its Quality Score is 80%.
If one of the empty fields is marked as not applicable, the calculation is then based on 9 fields instead of 10. With 8 of those 9 fields completed, the score increases to 89%.
Print the report
You can print the Quality Report to share it with other teams or use it during meetings where you review data quality priorities.
Note: If the same field appears in tabs belonging to different Attribute Sets, the Tables section only displays tabs that contain at least one unique field. Therefore, if one tab already represents a shared field, another tab that contains only that same shared field will not be displayed. This helps keep the report easier to read.
Common Use Cases
The Quality Report is particularly useful when you want to prepare product information before publication, identify which fields are reducing the overall completion level, update missing values in bulk using Excel mode, or review fields that are no longer relevant to your current structure.
Best practices
Review the Tables tab regularly, keep your Excel mode view limited to the columns you actually need, and only mark a field as not applicable when it genuinely does not apply to that product. If your team works directly in product forms, hiding not applicable fields can also make the editing process cleaner and faster.
Was this article helpful?
That’s Great!
Thank you for your feedback
Sorry! We couldn't be helpful
Thank you for your feedback
Feedback sent
We appreciate your effort and will try to fix the article